Dawn Bonfield MBE
  • Home
  • COP26 Blogs 2021
  • Blog
  • Articles, Photos & Videos
  • Groups & Speaking Engagements
  • Stats etc
    • Gender Pay Gap
    • The Evidence
  • Contact

Statistics relating to gender

gcse to a level

Picture
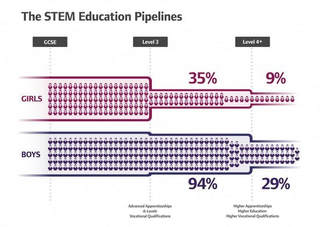
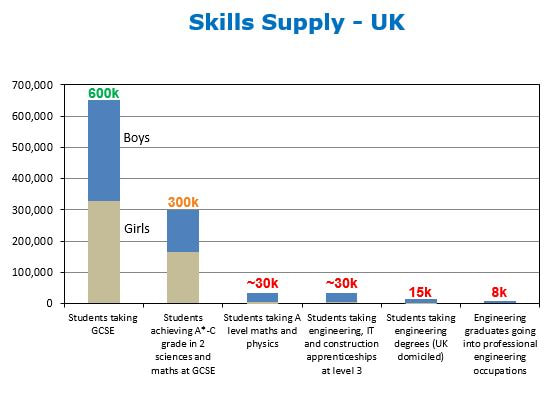
There is a huge drop off in the number of girls studying core STEM subjects at the age of 16. Just 35% of girls choose maths, physics, computing or a technical vocational qualification compared to 94% of boys. This reduces the number going on to do a degree or level 4 qualification in maths, physics, computer science or engineering – 9% of girls compared to 29% of boys.
Reference The Wise Campaign
  • 34% of 7-11-year-old females expressed an interest in engineering, compared to 59% of boys (EngineeringUK Brand monitor survey)
  • 20% girls take physics A level. From these, 40% of boys go on to an engineering course and only 25% of the girls (so out of every 100 physics students 5 girls and 32 boys go into an engineering course)
  • Half of all state schools in the UK don't have any girls studying physics A level


Stereotyping in school

Picture
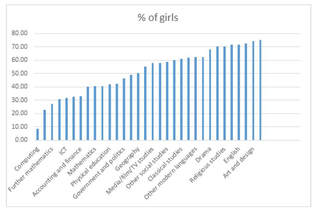
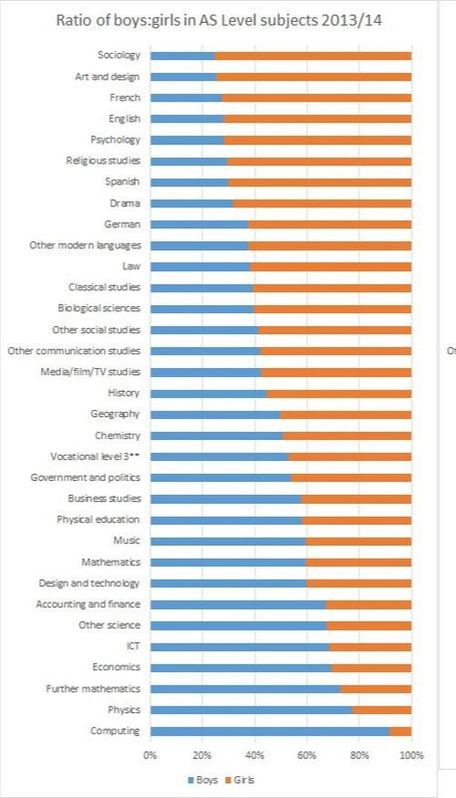
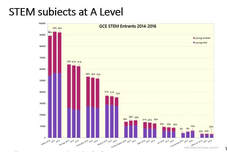
Gender stereotyping in schools is one reason why girls don't choose more STEM subjects. Here is a graph to show the national average of pupils taking particular school subjects at A level. 
See my idea for measuring gender stereotyping in school here.

Gatsby's Key Indicators in STEM Education

According to data from the Independent Schools Council, published in 2016, the GCSE performance for girls and boys is higher in a Diamond Model environment (which involves STEM lessons moving from mixed classes in lower years, to single-sex lessons between the ages of 13-15, and then back to mixed sixth form lessons) than in a fully co-ed one, with 96.4% of girls achieving five A*-C grades compared to 89.7% in a co-ed environment, and 97.8% of boys achieving five A*-C grades compared to 87.6%


apprenticeships
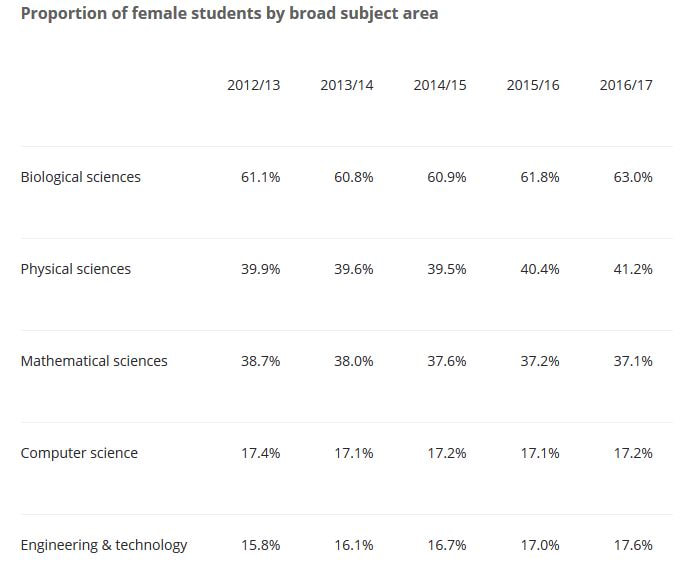
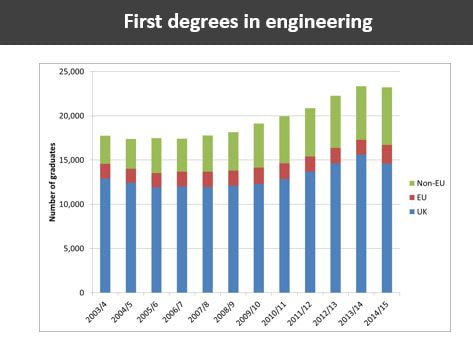
  • Of the 908,700 apprentices participating in 2016/17, 51.2% were female and 48.8% male.
  • 7% of engineering apprenticeships were completed by women in 2017 (EngineeringUK 2017)
  • Females completed 16.9% (1,460) of ICT apprenticeships, 8.2% (1,590) of Engineering and Manufacturing Technologies apprenticeships and just 1.7% (200) of Construction, Planning & the Built Environment apprenticeships in 2016
  • The top five STEM types of apprenticeships completed by number of females in 2014/15 were: Industrial Applications (1,300), IT User (810), IT & Telecoms Professionals (650), Engineering (290) and Construction Skills (140)
  • The proportion of women completing apprenticeships across STEM frameworks has remained mostly static when compared to last year, with the exception of the Industrial Applications framework in which there was a 3% increase in the number of women completing an apprenticeship
  • An IAC survey found only 22% of students said they received “good” careersn advice and 30% of female respondents revealed they weren’t encouraged to take an apprenticeship by their school/college, almost double that of male students. The majority, 85%, said that they were encouraged to pursue higher education.

Higher Education

HESA data for 2016/17 is available here.
  • 17.6% of women were enrolled on Engineering and Technology degrees in 2016/17 which equates to 29,025 students, compared to 136,085 men (total number in all years)
  • 15.76% of female students completed degrees in 2016/17
  • 9.88% (190) Engineering Professors are female, excluding IT/Computer Science. (Including these subjects it is 11.1% (=290)
  • 4,140 women qualified as graduate engineers in 2016/17 compared to 22,140 men (18.7%) Ref.
  • The number of BAME students attending university is increasing far quicker than white students, black students report lower levels of satisfaction than other racial groups. They are also more likely to “drop out”, and have lower attainment levels than their white peers – even when they enter university with the same grades. Ref. The Conversation March 2018
  • Social Mobility: 18 year olds from the most advantaged groups are 2.4 times more likely to enter university than their disadvantaged peers, and 6.3 times more likely to attend
    one of the most selective institutions in the UK according to UCAS End of Cycle Report 2015
  • There is a pervasive gap in degree attainment and labour market outcomes between ethnic groups and between disabled and non-disabled students. Research by HEFCE found that in 2013–14 there was an unexplained difference of 15 percentage points between the proportions of white and BME graduates achieving a first or upper second degree, and an unexplained gap of three percentage points between the proportions of disabled and non-disabled graduates doing the same. HEFCE also found that graduates from almost all BME groups were less likely than white graduates to go into employment after graduation, with an unexplained differenceof over seven percentage points for Chinese and black African graduates and with the gaps in the proportions going onto professional employment actually increasing over time. The differences in the proportion of disabled students going into employment ranged from two to three percentage points immediately after study, and again gaps in the proportions going into professional employment grew over time. Reference from
    HEFCE (2015) Differences in degree outcomes: The effect of subject and student characteristics and HEFCE (2015) Differences in employment outcomes: Equality and diversity characteristics.


Research and Academia

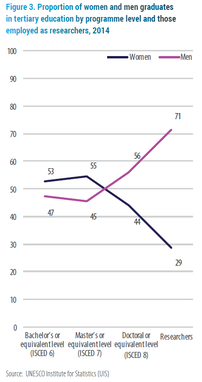
 (According to UNESCO, women represent less than 30% of the STEM R&D workforce worldwide. Ref. the SAGA Toolkit
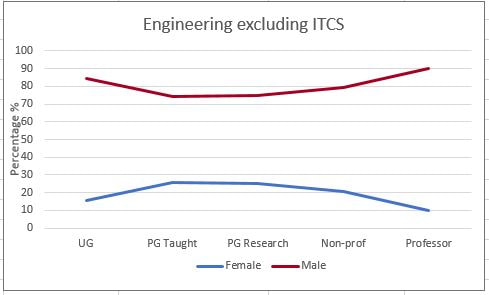
The 'Scissor Diagram' for Women in tertiary education on the left below from the same report shows the problem clearly, and the graph on the right shows the problem in engineering (2016/17) in the UK, where the handles of the scissors don't even come close!
Picture
Picture
Data from these sources:
  • HESA Statistics
  • Equality in Higher Education Statistical Report 2018

According to EPSRC during their Inclusion Matters funding call in 2017:
  • The academic population in Engineering and Physical Sciences (based on HESA) data is of the order of 17,200. The gender balance is poor with 17% women and 83% men.
  • The UK domicile student population in the Engineering and Physical Sciences is of the order of 15, 500. The gender balance is better with 26% women and 74% men.
  • The number and proportion of applications received from women, both as PI and Co-I continue to increase but they are still lower than expected when compared to the HESA population.
  • The success rate for women applicants when they apply as PI in 2015/16 is 32.4%
  • As the value of the grant increases the proportion of women applying as PI is lower than that for men, with the proportion of women PIs receiving funding also being significantly lower than for men as the grant value increases. As the grant value increases women are more likely to apply as Co-I.
  • There is no discernible pattern in the age related success rate data for both PI and Co-I.
  • In 2015/16 the number of PI and Co-I describing themselves as Asian, Black, Chinese, Mixed or Other has risen to 17% and 14% respectively. A significant proportion of applicants in both categories (7%) have chosen not to disclose their ethnicity. Around four fifths of applicants describe themselves as White. Success rates have been fairly consistent across the years, with those that describe themselves as Asian, Black, Chinese, Mixed or Other continuing to be slightly lower.

Professionally registered engineers

Annual Registration Statistics Report 2017 from the Engineering Council shows that 5.6% of registrants overall are female. Among new final stage registrants in 2017, 10.66% (across all titles) are female, up from 8.57% in 2013; among new final stage Chartered Engineer registrants, 13.09% are female.

Careers in engineering

  • 10% of women work as engineers in the UK in 2017 Ref. IET
  • 6% of women are professionally registered engineers in 2017 Ref. Engineering Council
  • 76% of students continue into a career where they actually know somebody who does that career
  • Parents and peers are 57% influential on their children’s careers compared to teachers who are only 28% influential Ref. Tomorrow's Engineers survey
  • We face the largest skills gaps in the areas where we have the lowest diversity. Less than 25% of employees are women in four of the top five areas with the highest net STEM job requirements. (CASE Submission 2018)
  • The EngineeringUK Brand Manager survey found that most parents and, more worryingly, teachers believed they weren’t equipped to give advice. Only 36% of parents and 35% of teachers said they had the confidence to offer guidance about possible careers in engineering.
Picture

Picture
Picture
Picture
Picture
Picture
Picture
Picture
Picture
2018 Spotlight Report
Picture
EngineeringUK 2018 Stats
Picture

gender pay gap

In the UK in 2017 the gender pay gap stands at 9.1% for full time workers, and 18.4% for full and part-time workers. See this page for further break down.

worldwide view

Female participation in Engineering (from Engineering and Economic Growth: A Global View, Royal Academy of Engineering, September 2016)
Myanmar (65%), Tunisia (42%) and Honduras (41%) lead the world in gender parity among engineers, according to the latest data on female engineering graduates from the UNESCO. Of the countries where date is available, the gender gap is biggest in Ghana and Saudi Arabia. However, many richer countries such as Japan, Switzerland and the US have a poor recent record in this area. The latest UNESCO data shows that only 12.5% of Japanese engineering graduates in 2013 were women, followed by 14% in Switzerland and 18.9% in the US.
Women only make up 22% of engineering graduates in the UK. While the UK outperforms some CAETS countries in this regard, it is behind twelve CAETS countries for which data is available, including Denmark (35%), India (30%) and Sweden (29%). Across the 99 countries considered in the study the UK ranks 58th in gender parity, also lagging behind countries such as New Zealand, Brazil and Greece.
Download a list of global women in engineering reports here.